Variables and Variable Types
Intro to Social Science Research
Variables: Operationalization of Concepts
In data science, a variable is a measurable feature, attribute, and/or representation of a concept. It can have different values for different individuals.
Variables are often empirical measurements; they are metrics that researchers create to approximate the specific dimensions of an abstract concept of a research question.
The process of going from a concept, which may often be unmeasurable, to a definition of variable(s) and methods of measurement of these variable(s) is a process broadly referred to as operationalization.
| Concept | Variable(s) |
|---|---|
| Education level | Highest degree earned |
| Family background | Household income, in thousands of dollars Household size Parental/guardian immigrant status |
From the above it should be evident that the operationalization process has pitfalls! Wikipedia describes this issue well with an example operationalizing the concept “anger.” One operation could be directly asking each participant their anger level. However, this self-evaluation process is not only subjective (individuals may define their own anger levels differently) but also often impractical (e.g., surveys or interviews may be impossible in an experimental setting).
In summary, operationalization necessarily highlights certain dimensions of a concept, constructing certain precise dimensions and measurements while hiding or obscuring others. However, operationalization makes research practical. Through operational definitions, it constructs procedures for measuring and collecting data. By translating immeasurable concepts into numeric or categorical quantities, one can then conduct statistical and graphical analysis on the data.
Variables in Tabular Data
We will see that as data scientists, we may often start with a dataset involving data that have already been collected for us. These datasets may have been constructed to answer specific questions (we’ll get into the research methods a bit later) and later shared to the broader public for transparency and reproducibility.
It is challenging to use another person’s data! The concepts have already been operationalized into variables; or the quality of data may vary widely; or multiple data sources may be needed to construct a reasonable first step towards a new research question. We’ll see more benefits and drawbacks in our examples this semester.
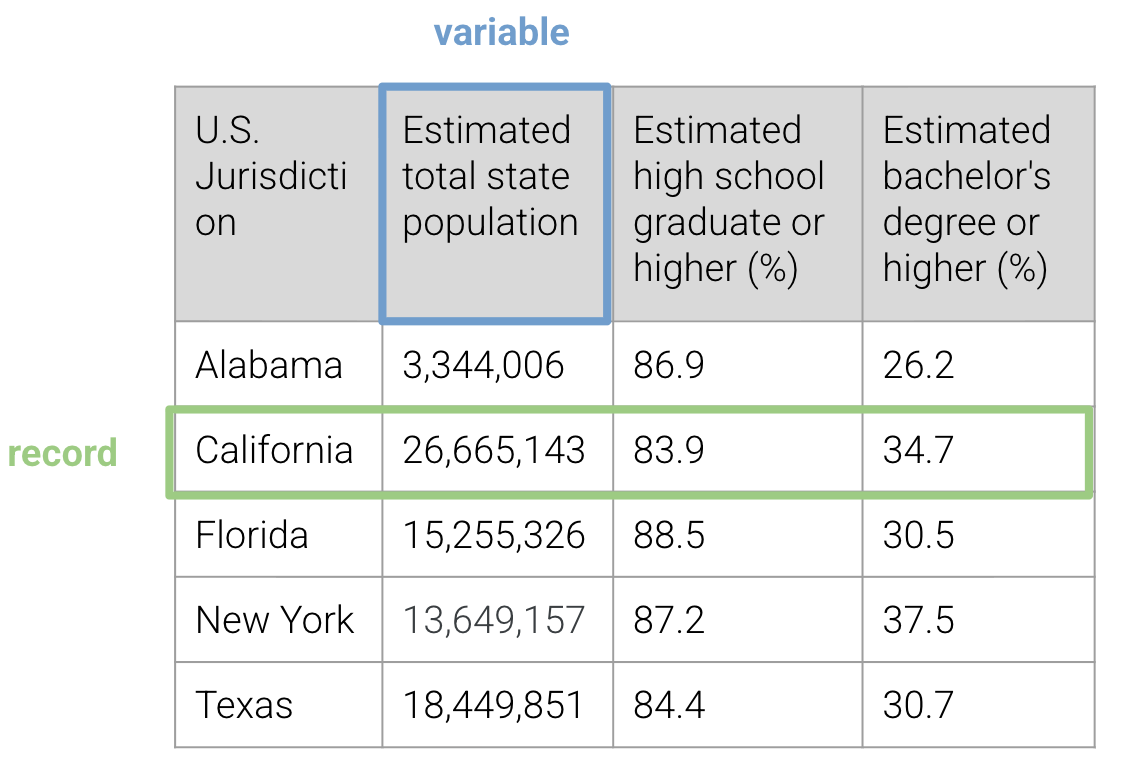
For now, we focus on variables as they exist in tabular data. In most of the tabular datasets we will examine, variables correspond to columns of features. Each row is a record of a datapoint, with different values of variables measured for that datapoint.
Variable Types
Variable types are different from Python data types like string, int, etc. Variable types help us make more informed decisions about how to measure and analyze variables: to make comparisons, create visualizations, and draw conclusions.
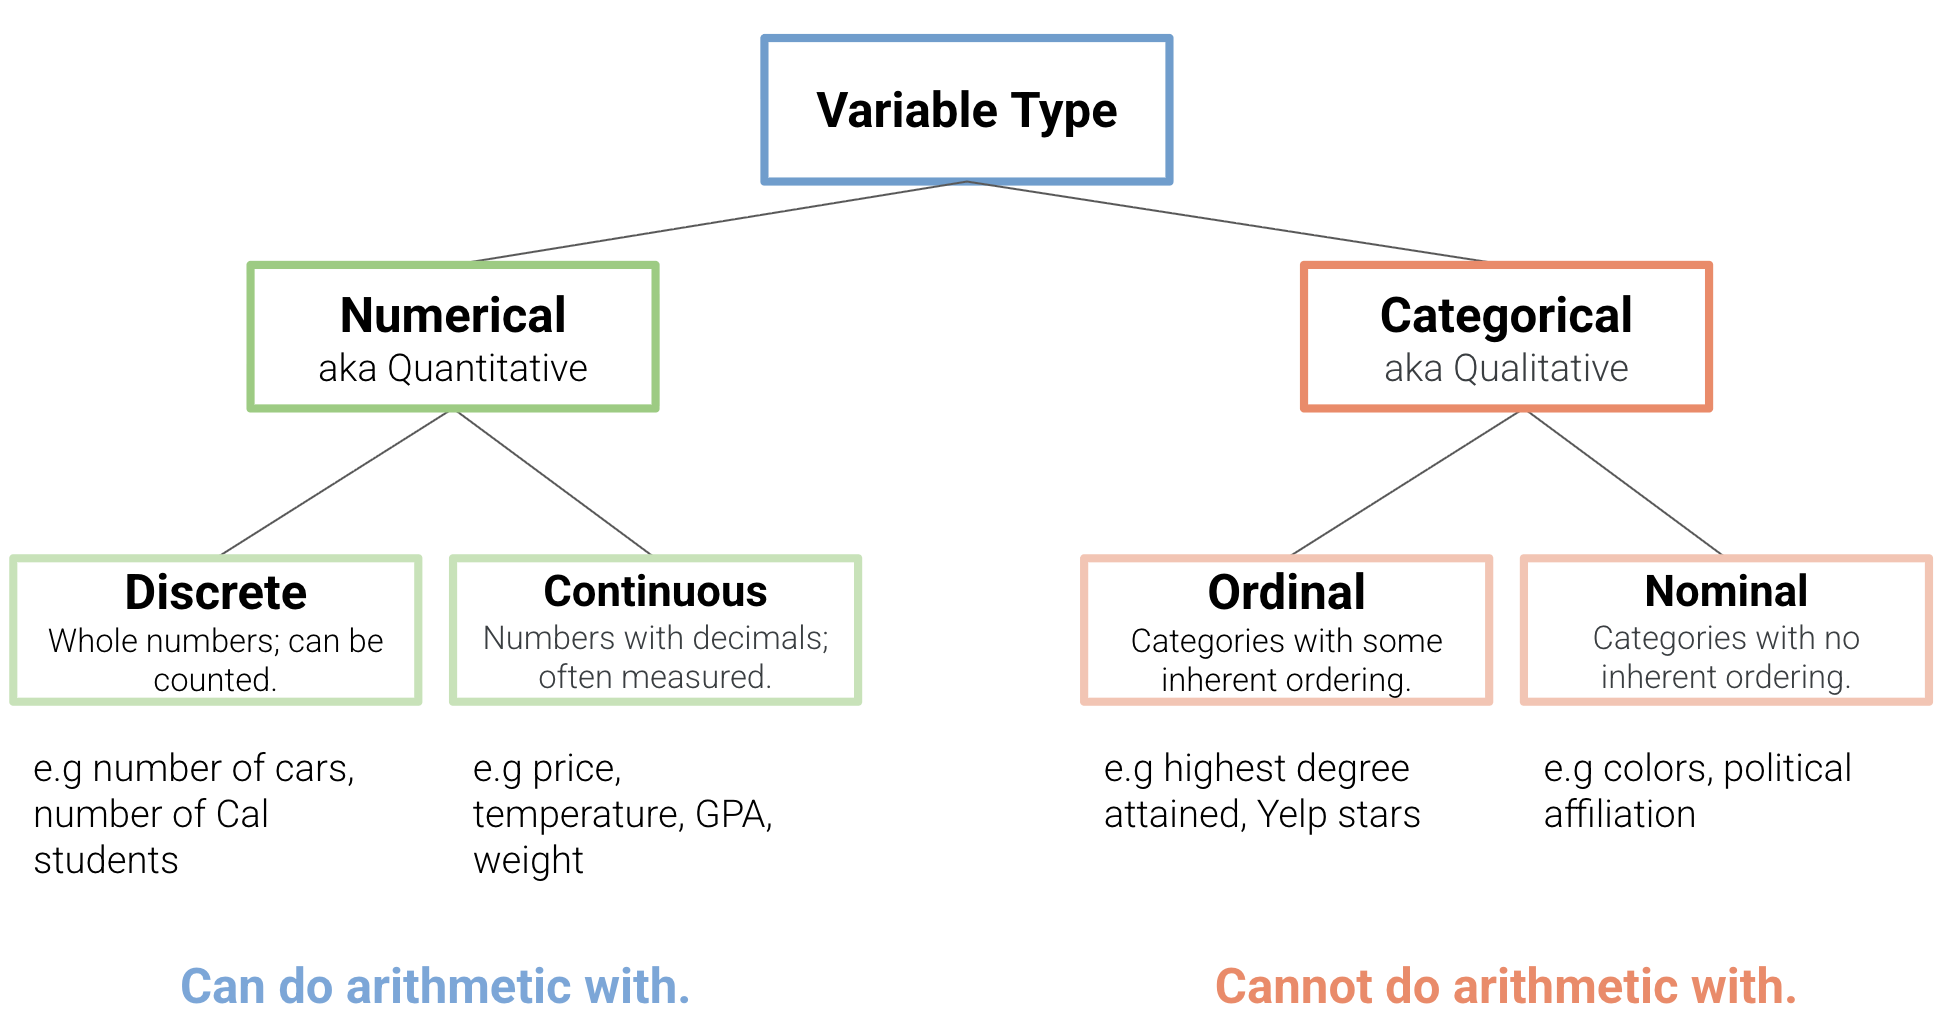
- Numerical/Quantitative Variable: a variable that takes numbers as values and where the magnitude of the number has a quantitative meaning.
- Discrete: A numerical variable that takes values that have jumps between them.
- Continuous: A numerical variable that takes values on an interval of the real number line.
- Categorical/Qualitative Variable: a variable that takes categories as values. Each unique category is called a level.
- Ordinal: A categorical variable with levels that have a natural ordering.
- Nominal: A categorical variable with levels that have no ordering.
Figure 2 has examples of each variable type.
What do we mean by “meaningful” arithmetic? From Stat 20:
What unites both types of numerical variables is that the magnitude of the numbers have meaning and you can perform mathematical operations on them and the result also has meaning. It is possible and meaningful to talk about the average air temperature across three locations. It is also possible and meaningful to talk about the sum total number of people across ten households.
Just because a variable has numbers for values does not make it numerical. Consider phone area codes: Berkeley is 510, San Francisco is 415, Palo Alto is 650, and so on. While area codes are numbers, you can’t do any arithmetic—comparative or otherwise—with them that “makes sense”: what does it mean to add area codes? have one area code (650) that is “larger” than another (510)? Area codes are therefore an example of a nominal categorical variable.
Variable types are closely tied to measurement. Consider the following survey item from Stat 20, which describes a common ordinal categorical variable in opinion surveys:
Consider the question:“Do you strongly agree, agree, feel neutral about, disagree, or strongly disagree with the following statement: Dogs are better than cats?” When you record answers to this question, you’re recording measurements on a categorical variable that takes values “strongly agree”, “agree”, “neutral”, “disagree”, “strongly disagree”. Those are the levels of the categorical variable and they have a natural ordering: “strongly agree” is closer to “agree” than it is to “strongly disagree”.
The above is an example of a Likert item. The researcher likely wanted a way to measure respondents’ sentiment of dogs and cats—an abstract concept. To do so, the researcher distributed a survey to respondents that operationalized this concept as a 5-point ordinal categorical variable. (There are of course other ways to measure this sentiment, such as by interviewing respondents and asking the open-ended question, “Dogs or cats?” but these yield a different set of possible responses and, consequently a different set of variables.)
Aside: What is a discrete variable type, really? If you think about it deeply from a Computer Science perspective, there will be cases in which continuous numerical variables may seem discrete: after all, price (in U.S. dollars) is counted to the cent, and so there are a discrete number of prices for, say, a pound of apples (we hope). However, in the data world we consider how the variable type may inform how we construct informative visualizations of the variable itself and compare it to other values. In short, variable typing informs our choice of using histograms vs. scatter plots, and so on. More later on this.
External Reading
- (mentioned in notes) “Chapter 4: From Concepts to Models.” Elizabeth Heger Boyle, Deborah Carr, Benjamin Cornwell, Shelley Correll, Robert Crosnoe, Jeremy Freese, and Waters, Mary C. 2017. The Art and Science of Social Research. New York: W. W. Norton & Company.
- (mentioned in notes) Stat 20 notes, Taxonomy of Data
References
U.S. Census Bureau, “EDUCATIONAL ATTAINMENT,” American Community Survey 5-Year Estimates Subject Tables, Table S1501, 2020, https://data.census.gov/table/ACSST5Y2020.S1501?q=2020+education&t=Age+and+Sex:Educational+Attainment&g=010XX00US$0400000, accessed on August 24, 2025.
U.S. Census Bureau, “Design and Methodology Report.” https://www.census.gov/programs-surveys/acs/methodology/design-and-methodology.html, accessed on September 2, 2025.
U.S. Census Bureau, “Public Use Microdata Sample (PUMS).” https://www.census.gov/programs-surveys/acs/microdata.html, accessed on September 2, 2025.